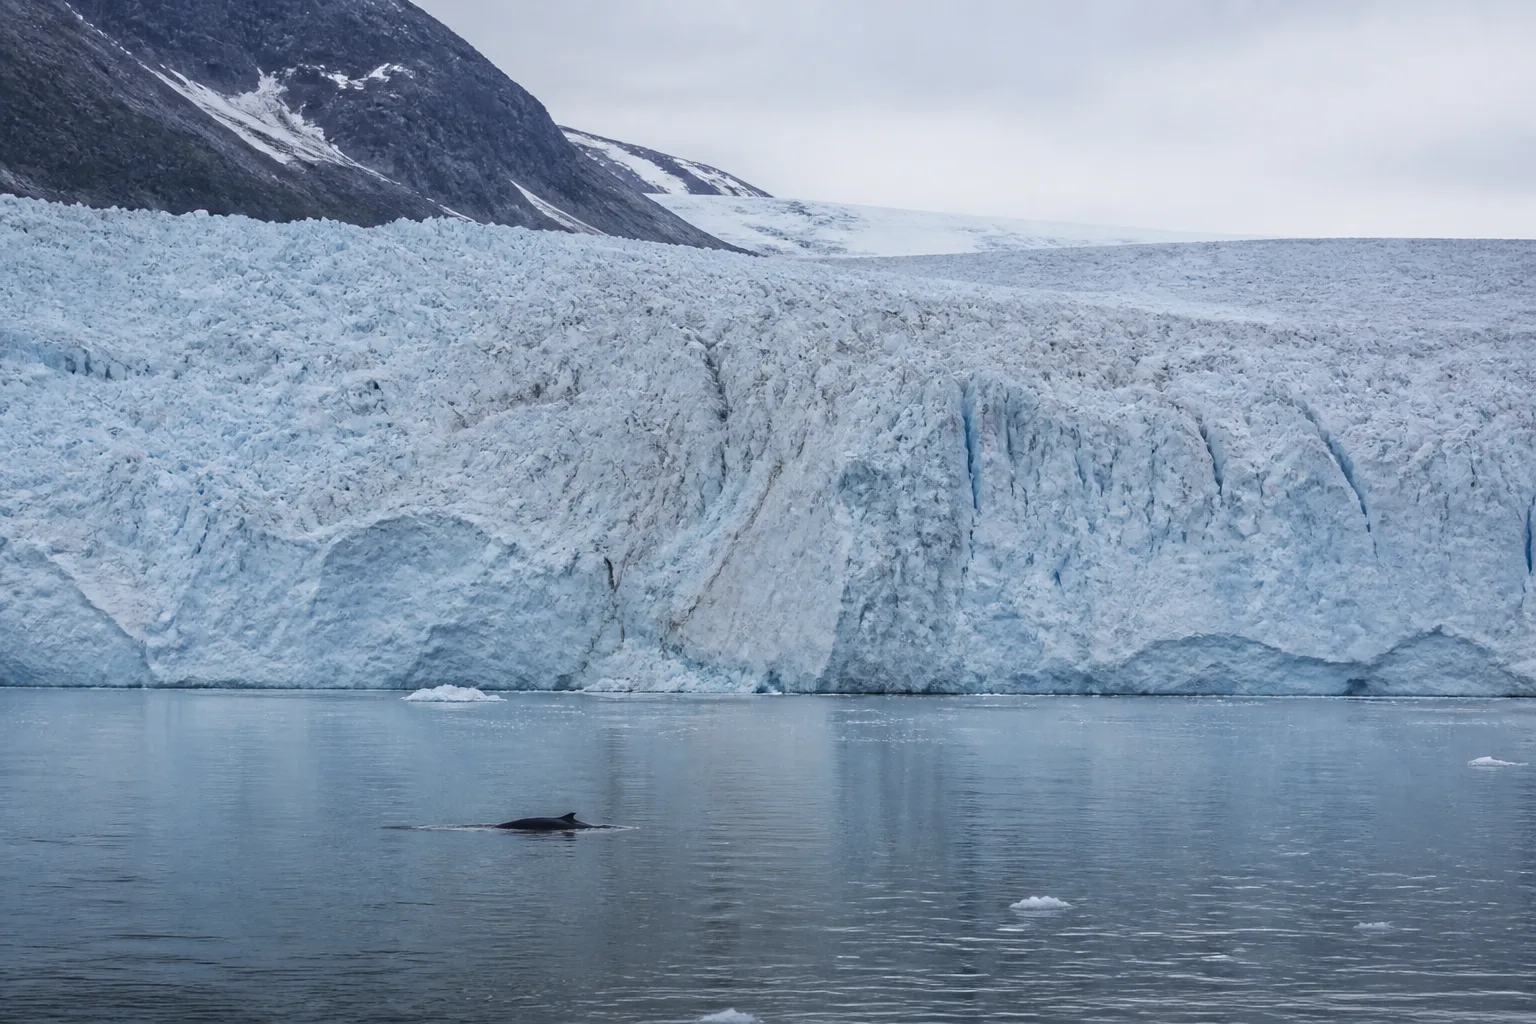
The NOAA Arctic Report Card 2025 brings many observing systems and expert chapters into one public assessment. This page selects a small set of reported facts and keeps their baselines, units, and uncertainty nearby. The figures are NOAA results, not measurements made by the fictional Still North institute.
A warm Arctic water year
The Surface Air Temperature chapter reports that the 2025 Arctic water year was the warmest since at least 1900. The annual mean surface air temperature was 1.60°C above the 1991 to 2020 average. The period and baseline define the comparison. They should travel with the number whenever it is quoted.
Sea ice at both seasonal limits
The Sea Ice chapter reports the lowest March maximum in the satellite era. The September daily minimum was 4.60 million km² and ranked tenth lowest in the satellite record. Maximum and minimum describe different seasonal moments. Extent also differs from area, thickness, volume, age, and local ice conditions.
The same chapter reports that ice older than four years has declined by more than 95% since the 1980s. That change in age distribution helps explain why the present cover can respond differently to wind, waves, deformation, and melt. It does not mean every remaining older floe has disappeared or that a local thickness observation can stand in for the regional age record.
Greenland mass balance
The Greenland Ice Sheet chapter reports a mass balance of -129 ± 50 Gt for the assessed period. The plus-or-minus term is part of the result. Mass balance combines accumulation and losses from processes observed by different systems, so uncertainty reflects the evidence needed to estimate a whole ice sheet rather than a lack of scientific care.
Tundra greenness
The Tundra Greenness chapter reports the third-highest value in the 26-year MODIS satellite record. Greenness is a remote-sensing indicator, not a universal measure of ecological benefit. Local plant communities, moisture, snow, disturbance, insects, grazing, and seasonal timing can produce different consequences beneath a broad regional signal.
More than 200 rusting watersheds
The Rusting Rivers chapter documents more than 200 affected watersheds. Mineral exposure associated with thaw can alter color and chemistry, with potential consequences for water quality and habitat. The documented count is not a complete inventory, and orange color alone cannot identify the minerals, cause, duration, or biological effect at a particular stream.
Ocean and observing systems
The Atlantification chapter examines changing ocean conditions and their physical and ecological context. The observing-network chapter examines the stations, satellites, ships, community observations, data systems, people, gaps, and risks behind the wider record. Together they show why a headline result depends on sustained infrastructure and governance.
How to use this brief
| Reported result | Context to retain |
|---|---|
| +1.60°C | Arctic water year compared with the 1991 to 2020 average |
| 4.60 million km² | September daily sea-ice extent minimum, tenth lowest in the satellite record |
| -129 ± 50 Gt | Greenland mass balance with stated uncertainty |
| Third highest | Tundra greenness in the 26-year MODIS record |
| More than 200 | Documented rusting watersheds, not a complete census |
Download the sourced A4 brief for a compact version of this page. The PDF carries the same fictional-site disclosure and primary links.
Read the complete NOAA Arctic Report Card 2025 for chapter methods, authors, figures, and references. See Sources and methods for every primary URL used by this demonstration.